By Dr Minh Alexander, NHS whistleblower and former consultant psychiatrist
This is a brief report about raising concerns, as reflected by the annual national NHS staff survey.
The 2016 national NHS staff survey results for 240 trusts were published on 7 March this year. 1
I have extracted the results for all NHS trusts on the survey question about ‘I would feel secure raising concerns about unsafe clinical practice’, set against current CQC ratings, and uploaded the relevant database:
2016 national NHS staff survey speaking up and CQC ratings, as of 22 March 2017
Whistleblowers will see some familiar rogues amongst the data.
TRUSTS WITH ESTABLISHED SPEAK UP GUARDIANS
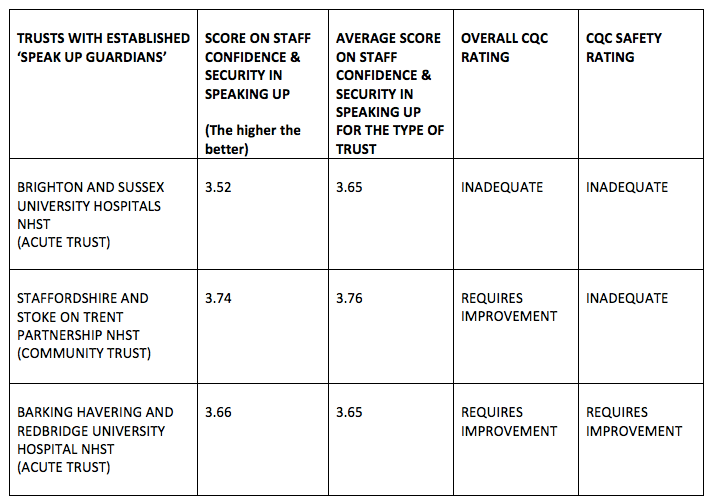
Significantly, three trusts that have had prototype Freedom To Speak Up Guardians for several years returned mediocre results on speaking up:
This will not be much of a surprise to most whistleblowers. A more detailed discussion of the lack of evidence base for Robert Francis’ Freedom to Speak Up Guardians can be found here:
https://minhalexander.com/2016/09/24/critique-of-francis-model-of-trust-appointed-guardians/
Let’s hope Henrietta Hughes is at least a little chastened by this latest evidence that Speak Up Guardian model doesn’t add much value.
BROAD FINDINGS
Overall, the summary briefing on the 2016 NHS staff survey reported that only 70% of NHS staff feel secure to speak up. 2
Percentages are given for individual trusts but the survey people advise that this information is unweighted and cannot be used to compare trusts.
However, it is very worrying that 30% of the million plus NHS workforce do not feel safe to raise concerns about unsafe care.
In some trusts the proportion of staff who feel safe to report concerns drops to as low as 55% (East of England Ambulance Service).
The percentages for individual NHS bodies can be found here – see question 13:
NHS Staff Survey 2016 unweighted question level data – reporting errors etc
For comparison, trusts are given weighted scores on staff confidence and security in speaking up, the higher the better. This is how the results on this question are displayed in each trust’s survey results:
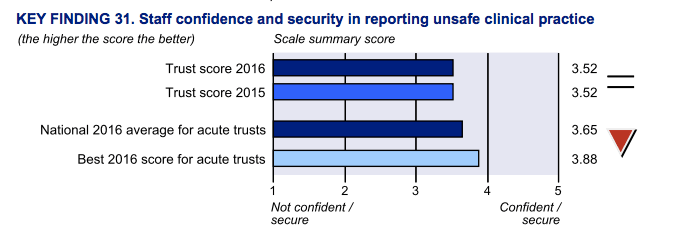
The above is the result for the troubled Brighton and Sussex University Hospitals NHS Trust, which is in the bottom 20% of acute trusts on this question
Looking at all 240 NHS trusts, the scores ranged between 3.14 – 3.94, with an average of 3.67.
Fittingly, the trust which has generated the most external whistleblowing disclosures to CQC in recent years, North Cumbria University Hospitals NHST, is fifth from the bottom nationally on its speaking up score.
CQC RATINGS
Doubts exist about both the confidentiality of the NHS staff survey and about whether CQC ratings are accurate. CQC ratings may not correlate with death rates 3, and CQC has recently taken to inexplicably rating trusts that ‘Require Improvement’ on safety as ‘Outstanding’ overall. 4
Without any assumptions about the integrity of either the staff survey data or CQC ratings, the gradient of reported difficulty in speaking up does seem to broadly correspond logically to overall CQC ratings:
| OVERALL CQC RATING |
2016 AVERAGE SCORE ON CONFIDENCE AND SECURITY IN SPEAKING
|
| TRUSTS RATED ‘OUTSTANDING’ (n=12) | 3.74 |
| TRUSTS RATED ‘GOOD’ BY CQC (n=90) | 3.72 |
| TRUSTS RATED ‘REQUIRES IMPROVEMENT’ BY CQC (n=128) | 3.64 |
| TRUSTS RATED ‘INADEQUATE’ BY CQC (n=9) | 3.51
|
|
NB. There was no CQC rating available for one trust (CQC had not yet allocated a rating for the London Ambulance Service).
|
|
Trusts’ scores on speaking up also seem to logically correspond with CQC safety ratings:
| CQC SAFETY RATINGS |
2016 AVERAGE SCORE ON CONFIDENCE AND SECURITY IN SPEAKING
|
| Trusts rated ‘Good’
(n=54) |
3.72 |
| Trusts rated ‘Requires Improvement’
(n= 166) |
3.67 |
| Trusts rated ‘Inadequate’
(n=18) |
3.55 |
| No trusts were rated ‘Outstanding’ on safety | N/A
|
|
NB. There was no CQC rating available for two trusts (the 5 Boroughs Partnership page of the CQC website was not functioning and CQC had not yet allocated a rating for the London Ambulance Service).
|
|
However, there are anomalies.
‘WORST’ AND ‘BEST’ TRUSTS
Twenty five trusts with the worst scores on speaking up (range 3.14 – 3.53) included one ‘Outstanding’ trust (West Midlands Ambulance Service) and two ‘Good’ trusts (Alder Hey Children’s NHS Foundation Trust and Yorkshire Ambulance Service).
This is a table of the 25 ‘worst’ scoring trusts on staff confidence about speaking up:
‘Worst’ 25 trusts on Speaking up 2016 NHS staff survey
The 25 best scoring trusts (range 3.82-3.94) included only 6 of the 12 trusts currently rated ‘Outstanding’ by CQC.
Seven of the 25 trusts which had the best scores on speaking up were rated ‘Requires Improvement’ by CQC.
This is a table on the 25 ‘best’ scoring trusts on staff confidence about speaking up:
‘Best’ 25 Trusts on Speaking up 2016 NHS staff survey
The variation in staff survey profile between different types of trusts is well known. Ambulance trust staff report the most difficulty with speaking up:
| TYPE OF NHS TRUST | 2016 AVERAGE SCORE ON STAFF CONFIDENCE AND SECURITY IN SPEAKING UP
|
| AMBULANCE | 3.46 |
| ACUTE | 3.65 |
| MENTAL HEALTH AND LEARNING DISABILITY | 3.67 |
| COMBINED ACUTE AND COMMUNITY | 3.68 |
| COMBINED MENTAL AND LEARNING DISABILITY, AND COMMUNITY | 3.71 |
| COMMUNITY | 3.76 |
|
NB These averages here are taken from the published staff survey data. I found some anomalies upon calculating the averages using the original supporting data, which I am querying with the survey authors.
|
|
DOCTORS v MANAGERS
Comparing the specific national staff survey results for doctors and general managers suggests that managers are more optimistic about speaking up….or at least report that they are more optimistic.
The average score for medical and dental staff in all trusts compared to the average score for general managers is 3.63 v 3.92.
(There is no separate data for doctors – they are grouped with dentists).
The difference between doctors and managers is found in all the different groups of trusts:
There are a range of possible explanations for this difference, but it is worrying when the perceptions of those at the sharp end diverge from those at the blunt end. Such divergence was identified by the Mid Staffs Public Inquiry and it has also been linked to poorer mortality outcomes:
Culture and behaviour NHS Dixon Woods bmjqs-2013-001947.full
Interestingly, the number of responses by managers may be small. There was no data on general management staff and speaking up for 21 trusts. This means either that the number of respondents were below 11, or that no responses at all were submitted by managers. The survey people say they will be publishing some more data about the level of responses by occupational group.
It is also interesting that a recent Royal College of Physicians survey reported that a much lower percentage of College members were confident in speaking up, than the 70% staff found to be confident by the national NHS staff survey.
Royal College of Physicians report, NHS Reality Check:
https://minhalexander.com/wp-content/uploads/2016/09/rcp-speak-up-guardians-march-2017.pdf
Royal College of Physicians summary survey data for the report:
Only 47% of College members responded affirmatively to this survey question:
“To what extent do you believe doctors in your organisation feel confident in raising concerns and issues?
- Very confident
- Confident
- Not confident
- Not confident at all
- Don’t know”
Only a fifth of the doctors surveyed knew who their trust Freedom To Speak Up Guardian was, and I understand that less than a third of these believed that “the Freedom to Speak Up Guardian has helped to improve the culture of transparency and raising concerns”.
Royal College of Physicians members represent a fairly distinct sample. The lower confidence about speaking up may relate in part to the special features and experience of this group. But a question also arises about whether the doctors were more comfortable to answer candidly to their Royal College, than to the NHS’ own survey.
But whatever sins the NHS official data is potentially concealing, the current evidence on staff freedom to speak up is pretty bad as it is.
REFERENCES
1 NHS staff survey 2016 results
http://www.nhsstaffsurveys.com/Page/1019/Past-Results/Staff-Survey-2016-Detailed-Spreadsheets/
2 Briefing notes: Issues highlighted by the NHS staff survey in England.7 March 2017
http://www.nhsstaffsurveys.com/Caches/Files/20170306_ST16_National%20Briefing_v6.0.pdf
3 Comparing a recent data analysis by Prof Brian Jarman on acute trust deaths rates against CQC ratings suggests that some trusts with the highest death rates are rated ‘Good’ by CQC, and some of the trusts with the lowest death rates are rated ‘Inadequate’ by CQC.
This is Prof Jarman’s data:
These are the trusts in the ‘high’ death rate band and their respective CQC ratings:

4 The Clatterbridge Cancer Centre NHS Foundation Trust and Birmingham Children and Women’s hospital NHS Foundation trusts.

